District-Wise Weekly
Dengue Risk AI Research
An advanced analytical research portal presenting data preprocessing, capping, feature scaling, and PCA dimension reduction techniques for predictive health surveillance models in Sri Lanka.
Research Abstract & Motivation
Dengue is a major seasonal public health crisis in Sri Lanka. This research implements robust data preprocessing pipelines to classify district-wise dengue risk levels as "High Risk" (weekly cases ≥ 75th percentile of the baseline for that district) or "Low Risk" (below the threshold), adjusting for population and historical distribution profiles across Sri Lanka.
By integrating weekly clinical case reports from the National Dengue Control Unit (Ministry of Health, Sri Lanka) with meteorological vectors (temperature, precipitation, sunshine duration, daylight duration, wind speed, and evapotranspiration) from the Open-Meteo API, the pipeline constructs a stable, normalized, and dimensionally reduced feature set suitable for high-accuracy classifier training.
Interactive Preprocessing Pipeline
Click on any of the processing stages below to explore the exact algorithms, code structures, and preprocessing methodologies designed by the research group.
PDF Extraction & Combined Cleaning
Overview
Extracting raw weekly case figures from public health PDF reports and merging them with district weather datasets.
Key Operations
- Automated PDF parsing via
pdfplumberand regular expressions matching Sri Lankan districts. - Temporal indexing based on ISO calendar standards (Monday start dates).
- Missing values identified and handled using robust forward-filling and chronological interpolation.
import pdfplumber
import re

# Parse District Cases
pattern = re.compile(rf"({'|'.join(districts)})\s+(\d+|Nil)")
with pdfplumber.open(pdf_path) as pdf:
    for page in pdf.pages:
        text = page.extract_text()
# Clean & extract numerical casesOutlier Capping & Weather Cleaning
Overview
Managing extreme meteorological fluctuations and anomalous values to stabilize model convergence and prevent predictive skew.
Key Operations
- Computed 1st and 99th percentiles for numerical weather variables.
- Implemented robust outlier capping (Winsorization) rather than deletion to retain extreme event weather indicators.
- Normalized severe rain spikes and evaporative index anomalies.
# Capping outliers based on percentiles
q_low = df['temp_mean_C'].quantile(0.01)
q_high = df['temp_mean_C'].quantile(0.99)

df['temp_mean_C'] = df['temp_mean_C'].clip(
    lower=q_low, upper=q_high
)Feature Engineering & Lags
Overview
Creating high-impact temporal features capturing mosquito breeding cycles (typically lagging weather events by 2 to 4 weeks).
Key Operations
- Constructed weekly lag columns for average precipitation and maximum temperatures.
- Engineered ecological ratios such as Daylight-to-Sunshine duration.
- Formulated District-specific moving averages to capture cumulative incubation thresholds.
# Engineering weather-lagged predictors
df['temp_lag_2'] = df.groupby('District')['temp_mean'].shift(2)
df['rain_lag_4'] = df.groupby('District')['precipitation_sum'].shift(4)
df['sunshine_daylight_ratio'] = (
    df['sunshine_duration'] / df['daylight_duration']
)Target & Categorical Encoding
Overview
Converting categorical district names and spatial tags into numerical vectors without injecting dimensional cardinality.
Key Operations
- Implemented risk-based Target Encoding mapping district categorical titles directly to mean historical risk level.
- Incorporated spatial indices and seasonal week-number indices.
- Enforced absolute category validation preventing data leakage from test partitions.
# Mean target encoding of categoricals
mean_risk = df.groupby('District')['risk_level'].mean()
df['District_encoded'] = df['District'].map(
    mean_risk
)Standard Scaling & Normalization
Overview
Scaling diverse measurement scales (e.g. rain sums in millimeters, sunshine seconds in tens of thousands) to uniform units.
Key Operations
- Applied Standard Scaling (Z-Score normalization) to all continuous weather predictors.
- Ensured scaling consistency required for distance-based clustering and PCA calculations.
- Scaled distributions to possess mean $\mu = 0$ and standard deviation $\sigma = 1$.
from sklearn.preprocessing import StandardScaler

scaler = StandardScaler()
cols_to_scale = ['precipitation_sum', 'temp_mean']
df[cols_to_scale] = scaler.fit_transform(
    df[cols_to_scale]
)Dimensionality Reduction (PCA)
Overview
Applying Principal Component Analysis to resolve multicollinearity in highly correlated meteorological dimensions.
Key Operations
- Extracted 7 principal components, preserving over 90% of the total weather dataset variance.
- Significantly reduced input dimensions, preventing overfitting in eventual models.
- Saves the processed outputs to the final dataset `DengueRisk_Final_processed_dataset.csv`.
from sklearn.decomposition import PCA

pca = PCA(n_components=7)
pca_features = pca.fit_transform(scaled_weather)
# Saves components PC1 to PC7
Exploratory Data Analysis Gallery
Browse the raw visual outputs of our data preprocessing and exploratory analysis stages. Click on any research plot card to view high-resolution figures alongside details and scientific descriptions.
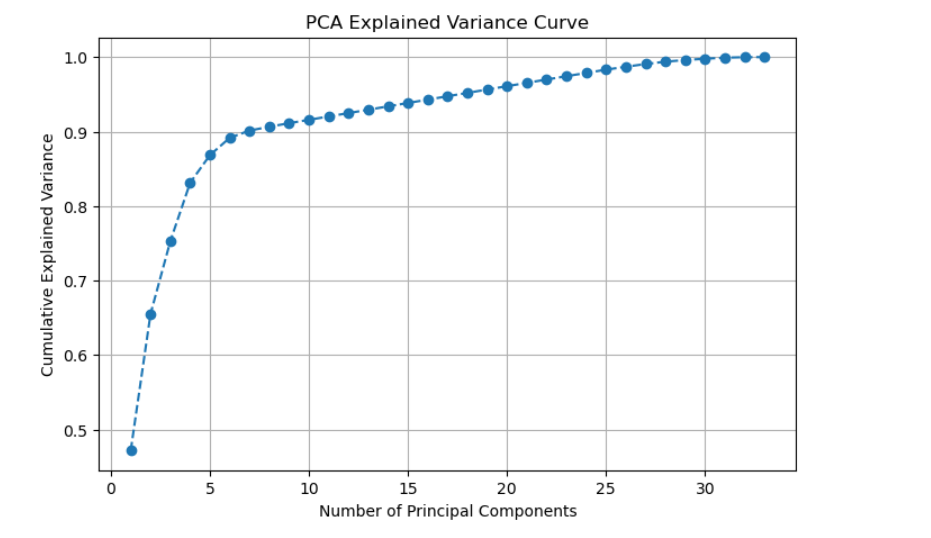
PCA Variance Curve
Scree plot displaying cumulative variance capture across components.
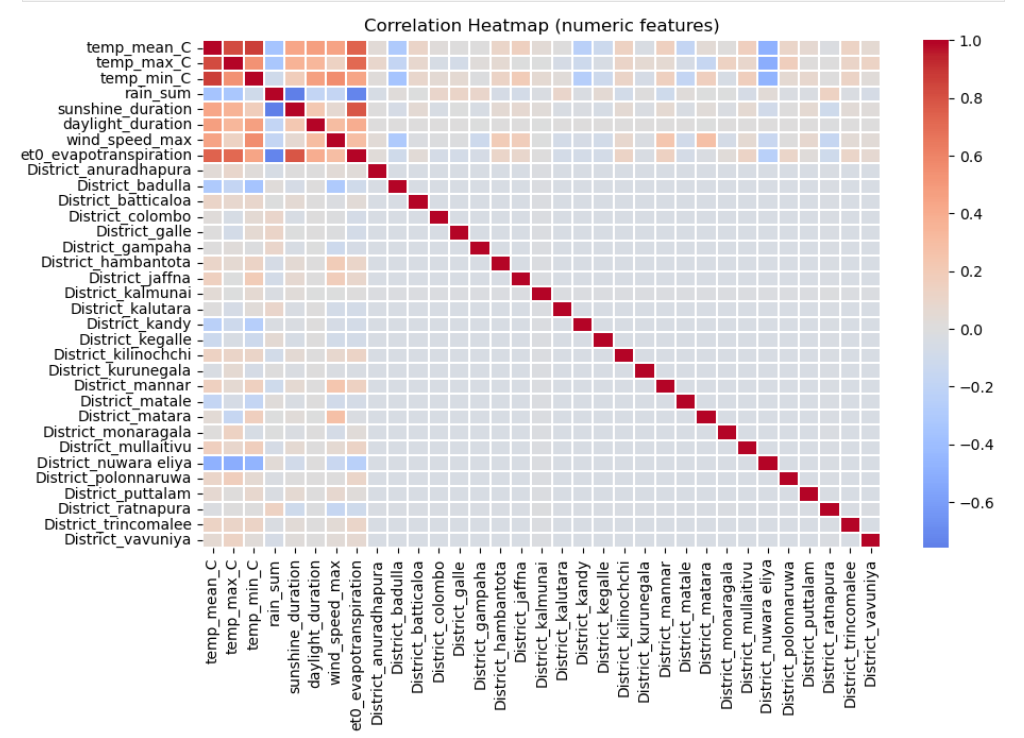
Correlation Heatmap
Visualizes linear correlation indices across multi-modal variables.
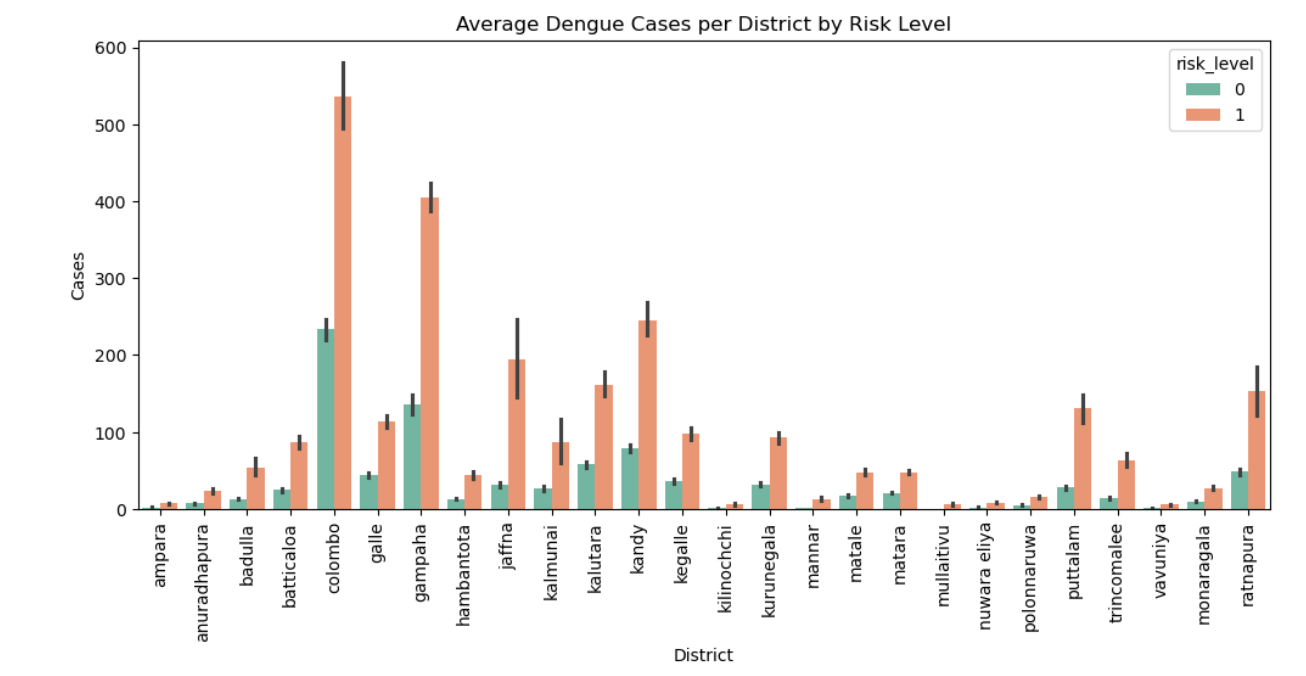
Cases & Risk Levels
District-specific distribution of cases under High/Low risk thresholds.
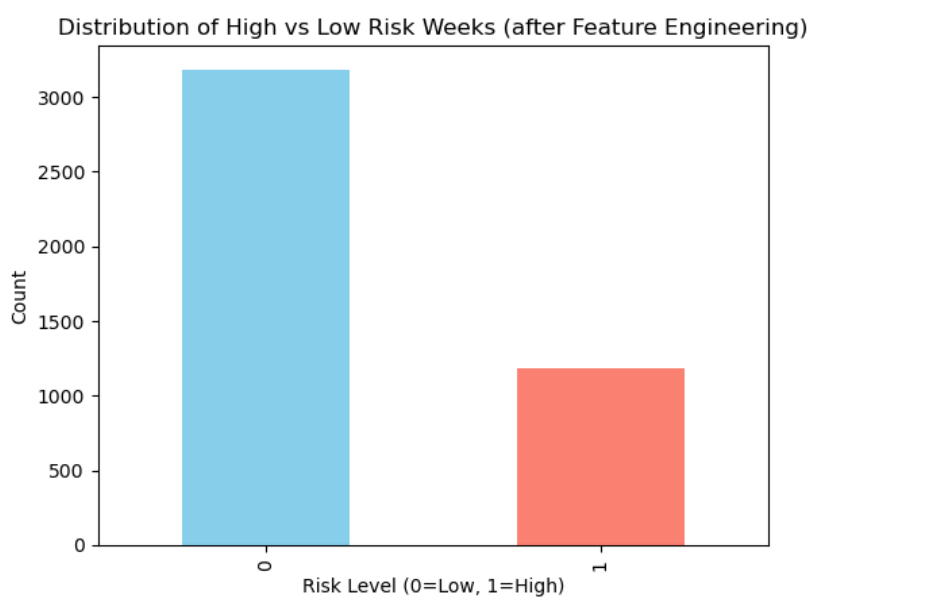
Risk Week Distribution
Proportions of High and Low Risk weeks across the timeline.
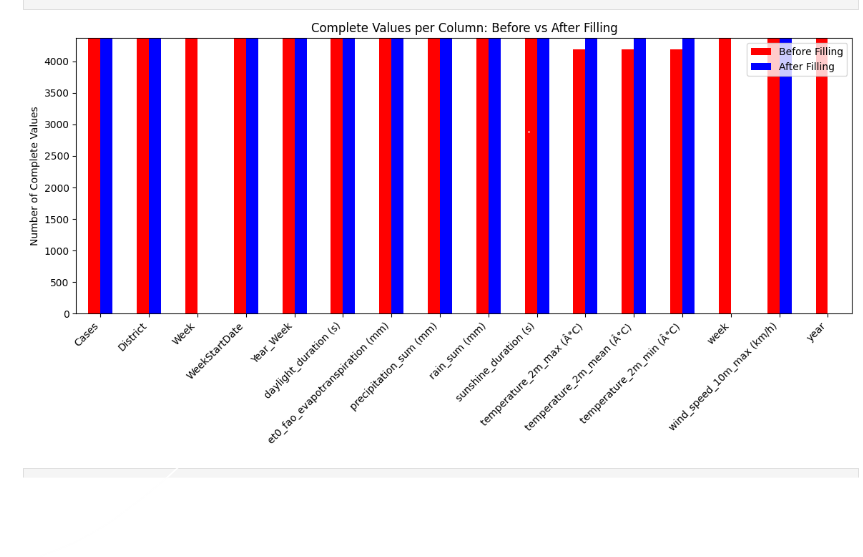
Missing Values Cleaning
Comparing missing counts before and after extraction-time imputation.
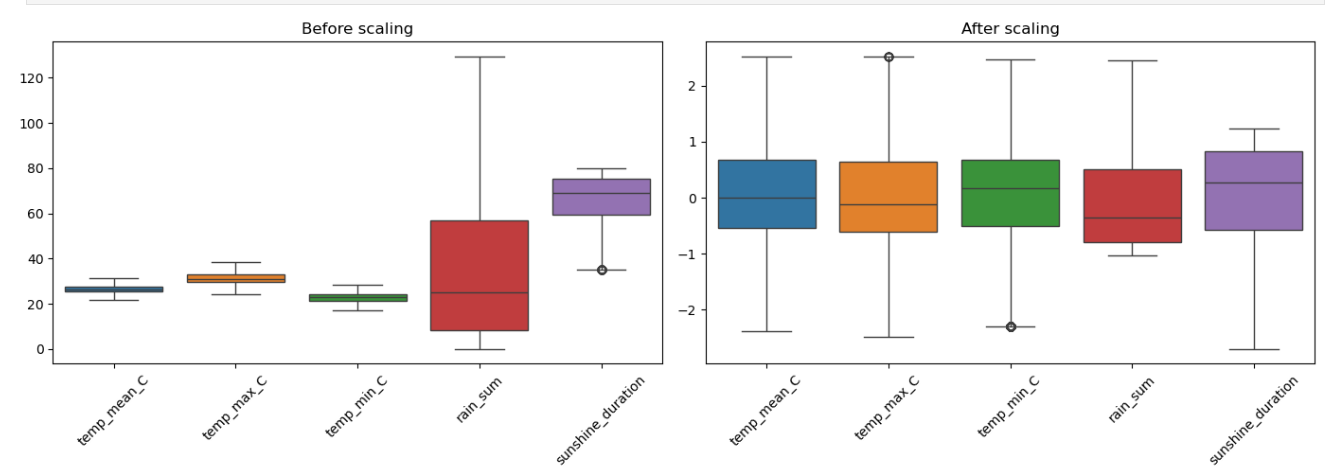
Scaling & Standardization
Distributions comparison before and after standard normalization.
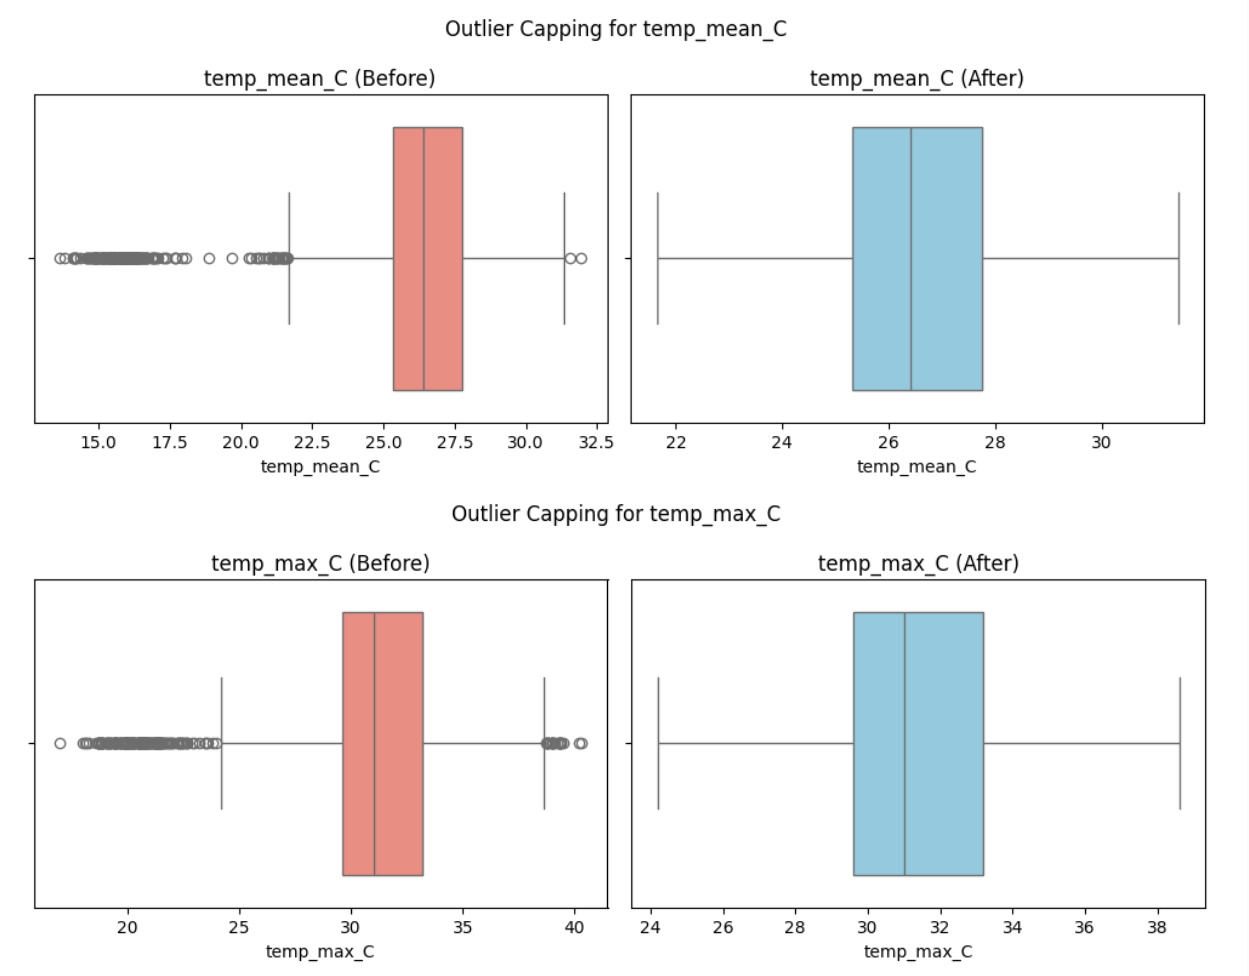
Temperature Outlier Capping
Cleaning temperature limits while keeping historical weather shifts.
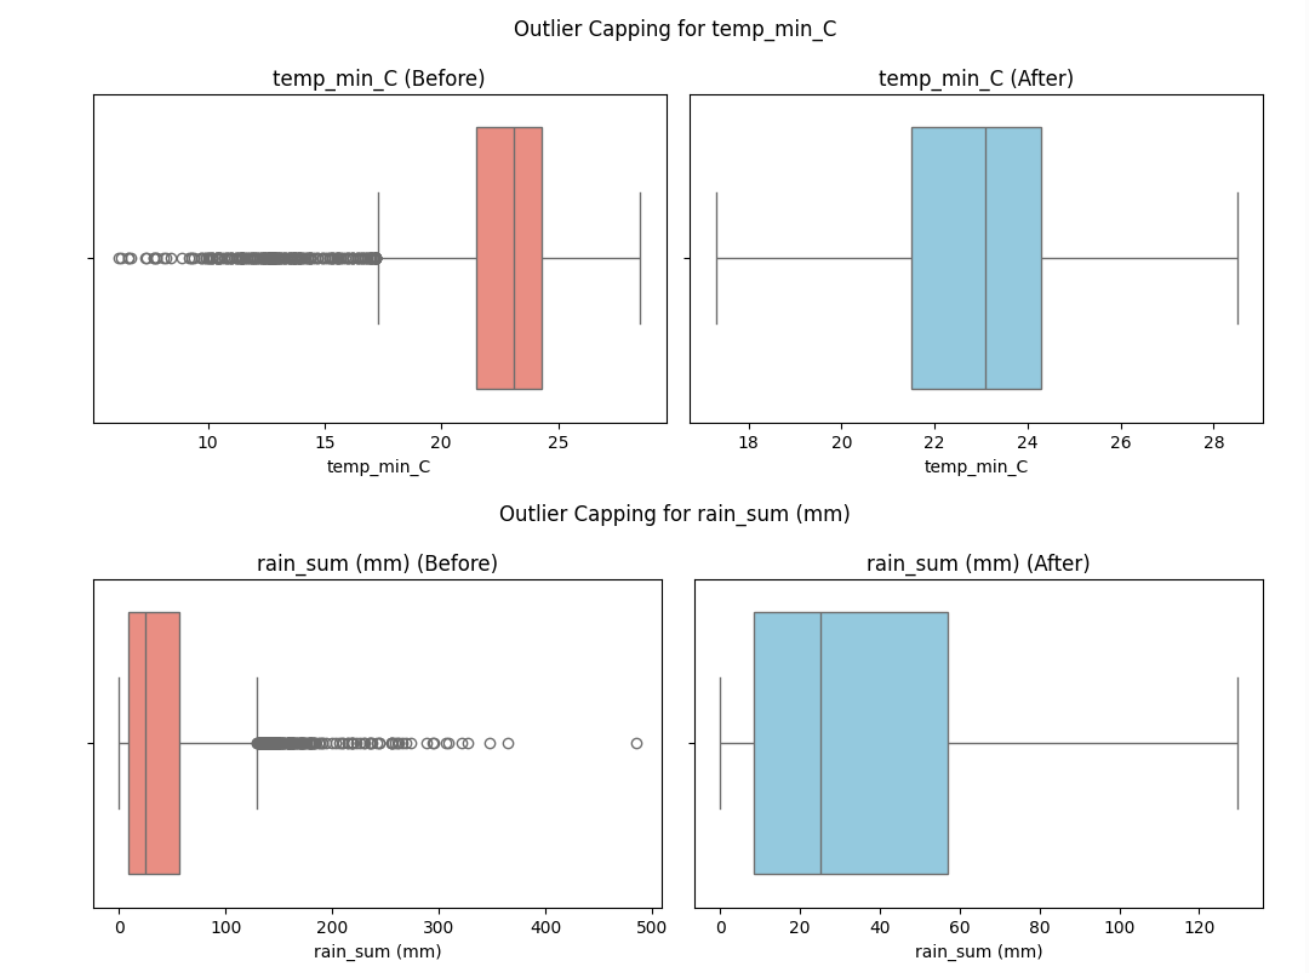
Rain Outlier Capping
Corrective capping for extreme minimum temperature and rainfall peaks.
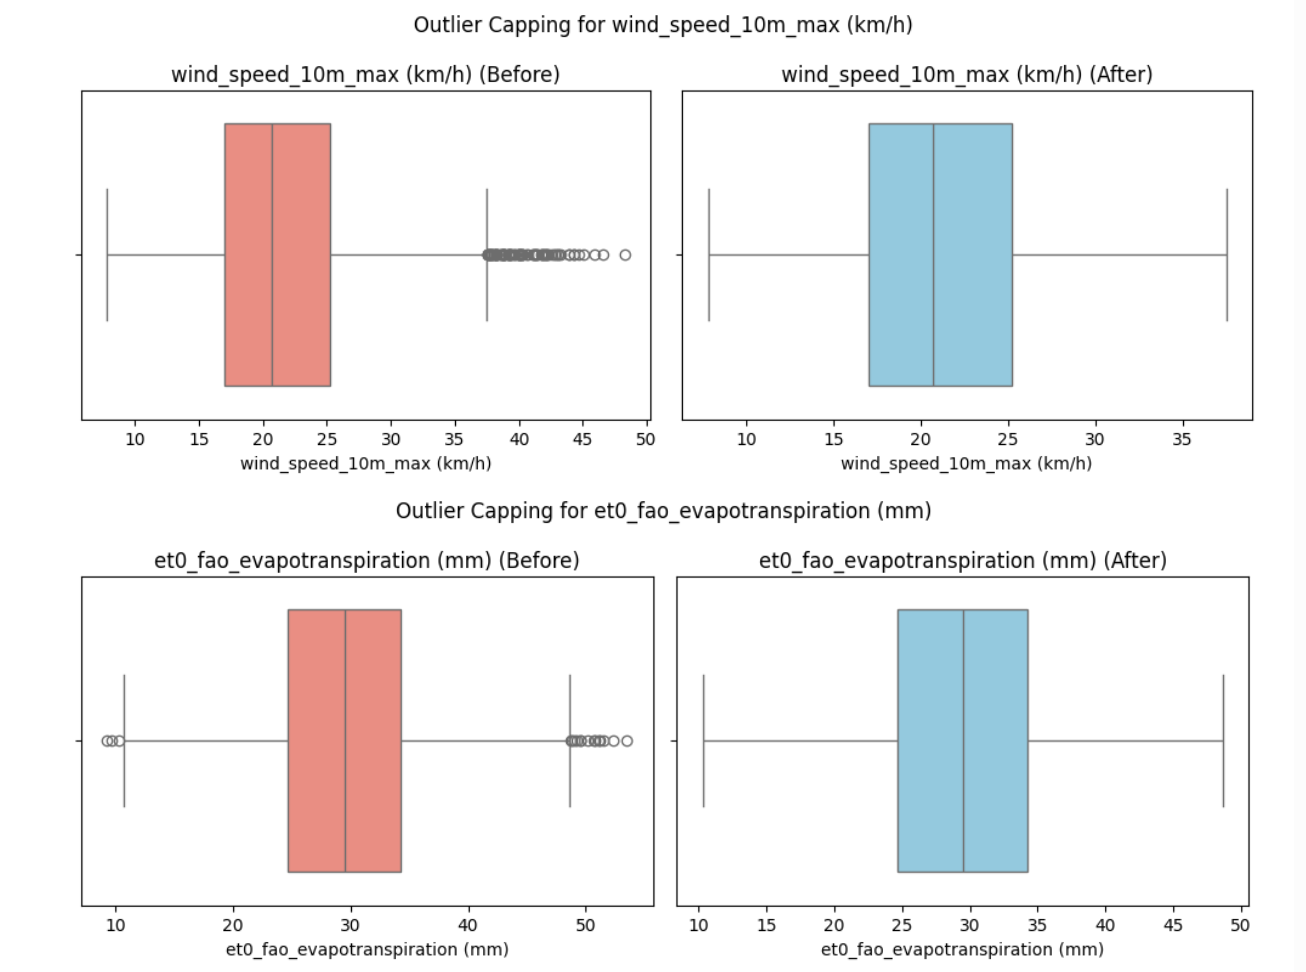
Wind & Evap Capping
Capping limits applied to wind speed and evapotranspiration datasets.
Interactive Climate Risk Simulator
Select a Sri Lankan district and manipulate weather sliders below to see in real-time how atmospheric shifts affect calculated dengue transmission probabilities (derived from client-side vector indices).